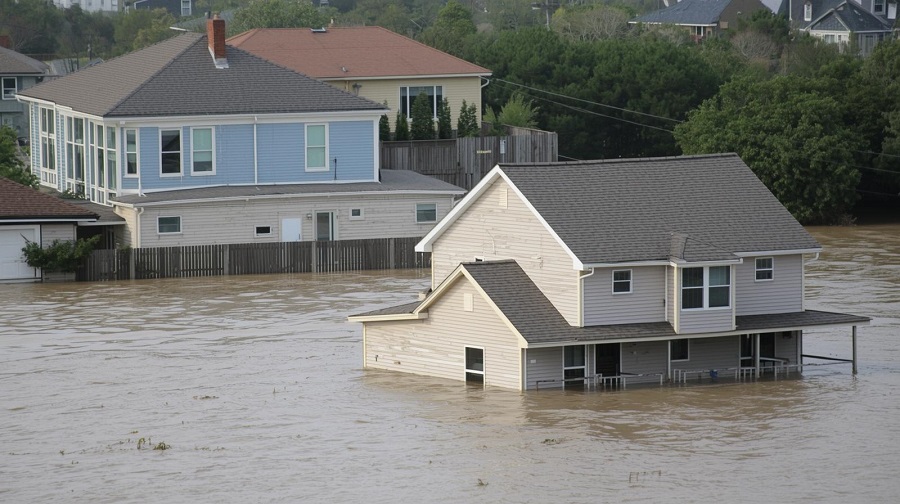
When Hurricane Ian hit Lee County, Mullock Creek Preserve and the surrounding neighborhoods disappeared under over eight feet of water. That wasn’t just a freak event. Afterward, FEMA stepped in and updated the flood maps for the region. It took almost four years, but those changes are about to kick in this summer. For many people, though, there’s still confusion about what these maps mean and why FEMA keeps changing them.
If you lived in Southwest Florida in late 2022, you remember Ian. A Category 4 storm came through, upending the entire region. The storm surge swamped low-lying coastal areas, pushing water over 12 feet above normal. Homes that seemed immovable floated away. Farther inland, the wind ripped through neighborhoods, with gusts topping 140 miles per hour. Everything became a projectile: coconuts, car parts, you name it. And then the aftermath: two weeks with no power for hundreds of thousands of people.
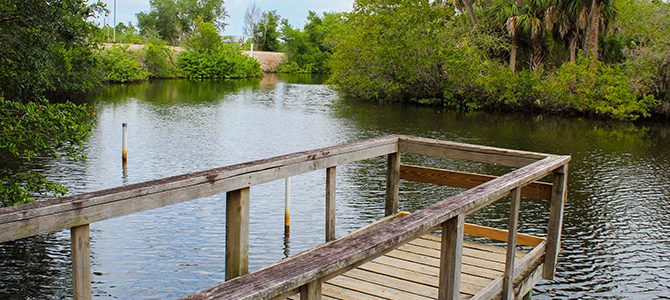
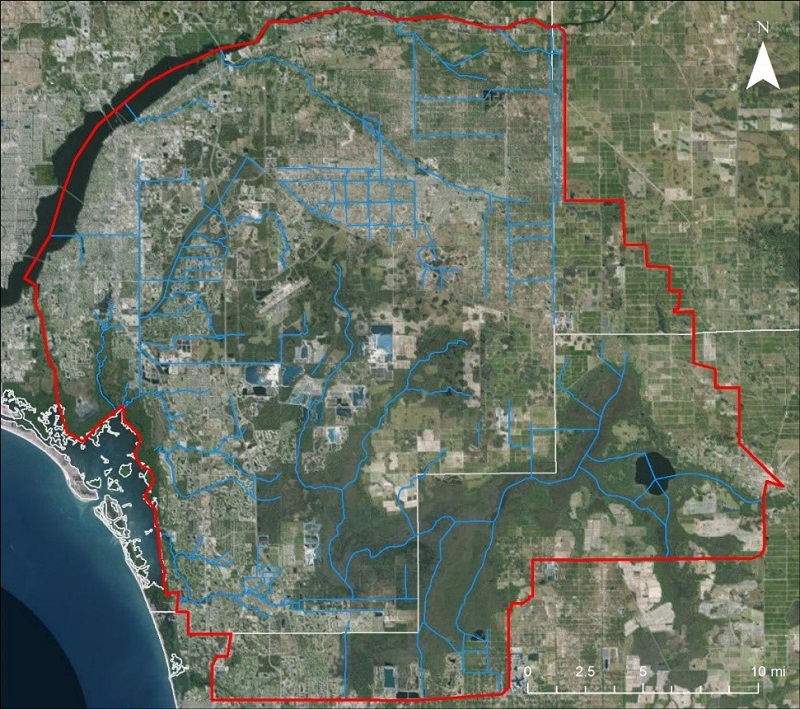
Mullock Creek Preserve sits in south Lee County. It’s a low, coastal area that plays a big role in the local watershed, affecting places like Estero and San Carlos Park. Ian hit there, too, flooding everything in sight.
FEMA updated its flood maps once again. These new maps decide what’s considered “at risk,” and they’re about to become the new standard. But here’s the thing: people often misunderstand what these maps are for. Dr. Donald Duke, who teaches ecology and environmental studies at Florida Gulf Coast University, says property owners need to stop thinking of flood maps as a clear line between safe and unsafe. “It’s a mistake to think of these maps as saying, ‘This area floods, that area doesn’t,’” Duke says. “That’s just not so.”
The reality? FEMA’s maps are built on probabilities. They’re the best guesses based on years of data on water flow and changes to the land. Every year, nearly half of the flood insurance claims come from outside the official flood zones. So, living outside the high-risk area doesn’t mean you’re in the clear.
Here’s how the process works. FEMA runs the main program and hands out funding. States get the money, then pass it on to towns and cities. There’s also the Community Rating System, or CRS, which keeps track of what communities do to cut down on flood risk. Communities earn points for taking action, and those points translate into better insurance premium discounts—anywhere from 5% to 45%, depending on their CRS class.
The flood maps aren’t just for show. Insurance companies use them to set rates and decide who has to buy flood insurance. Local governments look at them to set building codes. “It’s about probability,” Duke says. “If you’re more likely to get flooded, you’ll pay more—just like a driver with a history of accidents pays more for car insurance.”
With all the new construction, and Florida has plenty, FEMA must update the maps more often. The first flood map for Lee County came out in 1984. Then there was a long gap, but now updates happened in 2008, 2018, 2022, and another is coming in 2026. Why so many changes? Duke points to both more development, which changes how water moves, and the fact that the climate is getting wilder. “A map from 1970 just doesn’t cut it anymore,” he says. “Florida’s changed too much.”
If your property just ended up in a new flood zone and you’re worried about hurricane season, there are ways to protect yourself. Billie Jacoby, Lee County’s floodplain manager, says the most important step is getting flood insurance—don’t wait. “We’ve seen so many damaging storms lately. You need flood insurance, and you need to understand the Increased Cost of Compliance part of your policy,” Jacoby says. She also warns don’t put it off, since most policies won’t kick in for 30 days after you buy them.
For more information leegov.com.